Burp can test any REST API endpoint, provided you can use a normal client for that endpoint to generate normal traffic. The process is to proxy the client's traffic through Burp and then test it in the normal way.
Unless the API uses a Swagger file, there is no way to fully automate this without using a normal client, because REST API endpoints don't have a standard format for defining the requests that can be made to them (as can be done for SOAP endpoints via WSDL files). So there is no way around the need to generate sample traffic using a real client.
In some situations you will be able to access the API using your browser, however, this is not always possible. In this tutorial we demonstrate how to use an mobile device to proxy API traffic through Burp Suite.
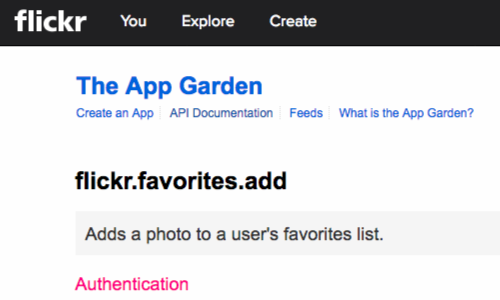
You can use this method to map an entire API, or locate and test a specific operation.
In this example we'll demonstrate the mapping process and locate the "favorite" operation on Flickr:
flickr.favorites.add
Ensure that your mobile device is correctly configured with Burp Suite.
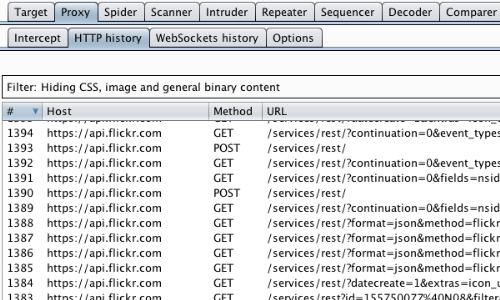
The next step is to access the app via your mobile device and ensure traffic is proxying via Burp.
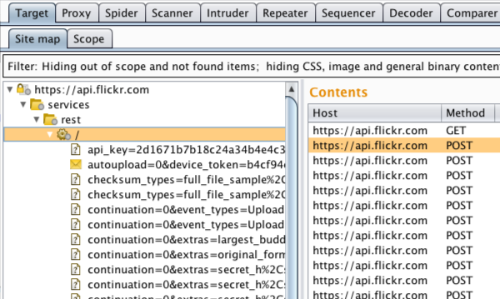
Using your mobile app working through Burp Proxy, manually map the application by following links, submitting forms, and stepping through multi-step processes. This process will populate the Proxy history and Target site map with all of the content requested.
From here you can send requests to Burp's various tool for manual or automated testing.
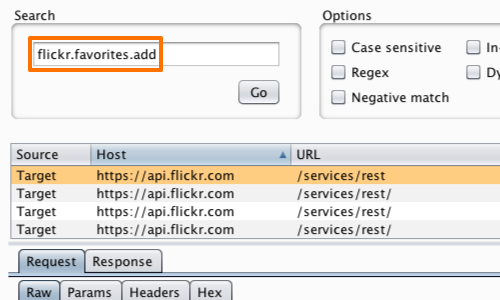
To locate a specific operation, you can use the search function from the Burp menu.
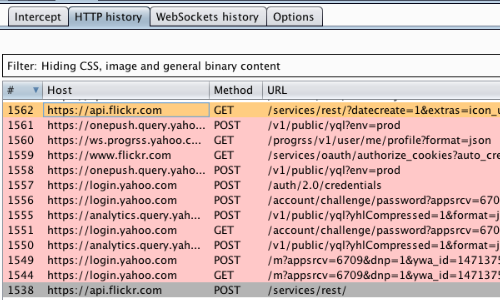
Alternatively, you can crawl specific operations and monitor the request and response process.
In this screenshot we have isolated and highlighted the log in process using the HTTP history console.
