


ProfessionalCommunity Edition
Filtering the HTTP history
-
Last updated: July 31, 2026
-
Read time: 2 Minutes
You can filter the HTTP history to make it easier to analyze. This enables you to systematically examine a large Proxy history and understand where different kinds of interesting requests appear.
The filter bar above the list of interactions describes the current display filter. To configure this, click the filter bar to open the HTTP history filter window.
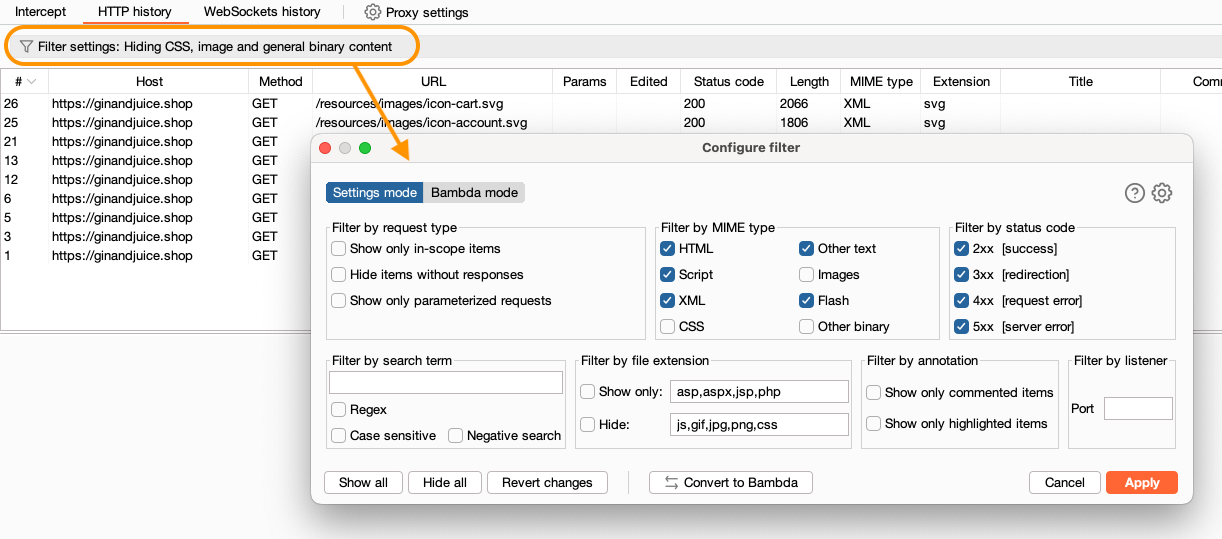
The HTTP history filter window has two tabs - Settings mode and Script mode.
The filters only control what is displayed. If you hide items, they are not deleted: they reappear if you reset the filter.
Note
To quickly toggle the filter and search bar on or off, click Filter on or Filter off. This enables you to compare filtered and unfiltered traffic without resetting your filter or search term.
Settings mode
Settings mode enables you to filter your HTTP history quickly, using the following settings:
-
Filter by request type - You can show:
- Only the items that are in-scope.
- Only items with responses.
- Only requests with parameters.
- Filter by MIME type - You can show or hide responses containing various different MIME types, such as HTML, CSS, or images.
- Filter by status code - You can show or hide responses with various HTTP status codes.
-
Filter by search term - You can:
- Filter responses that contain a specified search term.
- Use a literal string or a regular expression.
- Make your search case-sensitive.
- Select Negative search, so only items that don't match the search term are shown.
- Filter by file extension - You can show or hide items based on their file extension.
- Filter by annotation - This enables you to only show items with notes or highlights.
- Filter by listener - You can show items received on a specific listener port. This can be useful when testing access controls.
Script mode
Script mode enables you to apply Java-based scripts to define powerful custom filters. Learn more about scripts.
Adding annotations
You can add notes and highlights to history items. This enables you to describe the purpose of different items, and to flag interesting items for further investigation.
To highlight an HTTP history item:
- In the HTTP history tab, select the history item from the list.
- Right-click the item and select Highlight.
- Select a color from the list.
To add a note:
- In the HTTP history tab, select the history item from the list.
- Click Notes.
- Enter your comment in the Notes panel.
You can also annotate items as they appear in the Intercept tab. These automatically appear in the HTTP history.