


ProfessionalCommunity Edition
Getting started with Burp Logger
-
Last updated: July 23, 2026
-
Read time: 2 Minutes
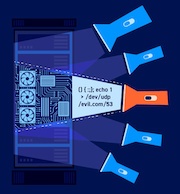
The Logger tab displays all the HTTP traffic sent between all of Burp's tools and your target websites. This includes tools or extensions that send requests automatically, such as Burp Scanner.
In this tutorial, you'll use Burp Logger to view requests sent by Burp Scanner and the resulting responses from target websites.
Step 1: Access the lab
Open Burp's browser and the Logger tab side by side.
Use Burp's browser to access the following URL:
https://portswigger.net/web-security/sql-injection/lab-retrieve-hidden-dataClick Access the lab and log in to your PortSwigger account if prompted. This opens your own instance of a deliberately vulnerable shopping website.
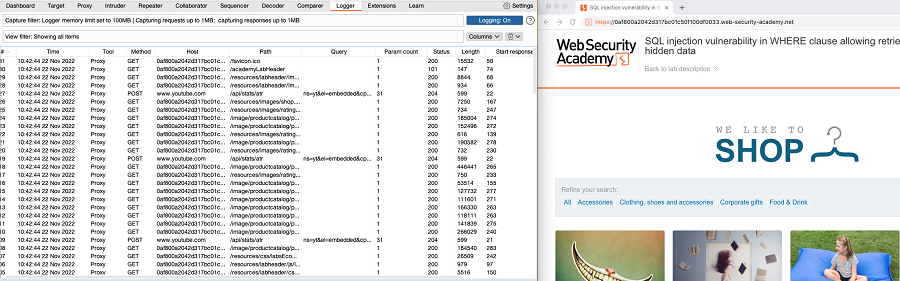
Step 2: View requests on the Logger tab
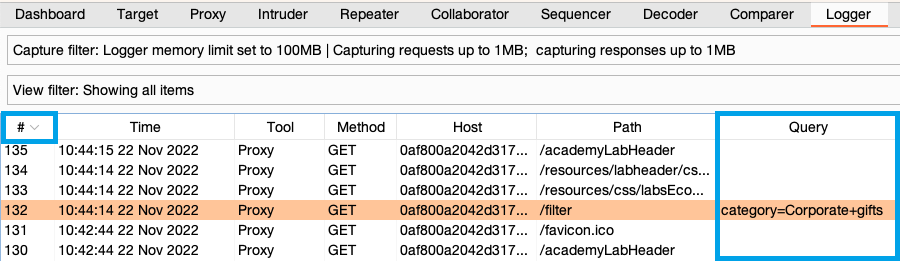
On the shopping site, apply one of the category filters. The Logger tab updates in real-time. Click the # column header to sort the log so that recent requests are on the top. Notice the new request with a category query parameter.
Step 3: Audit a request with Burp Scanner
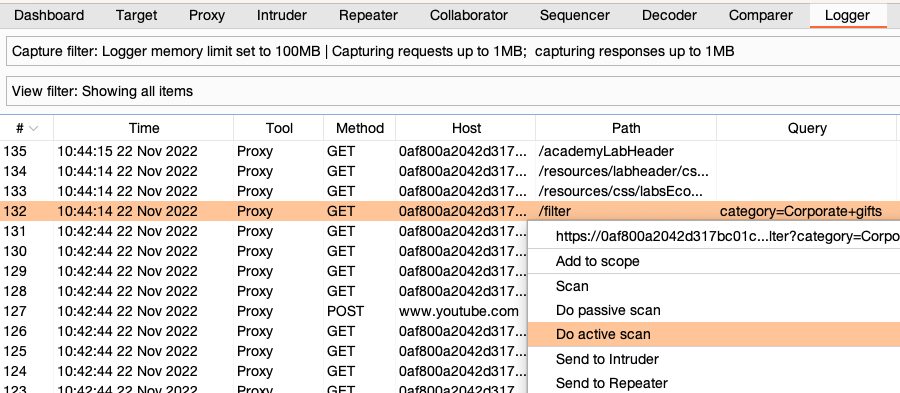
Right-click on the request with the category query parameter, then select Do active scan. Burp Scanner performs an audit with this request.
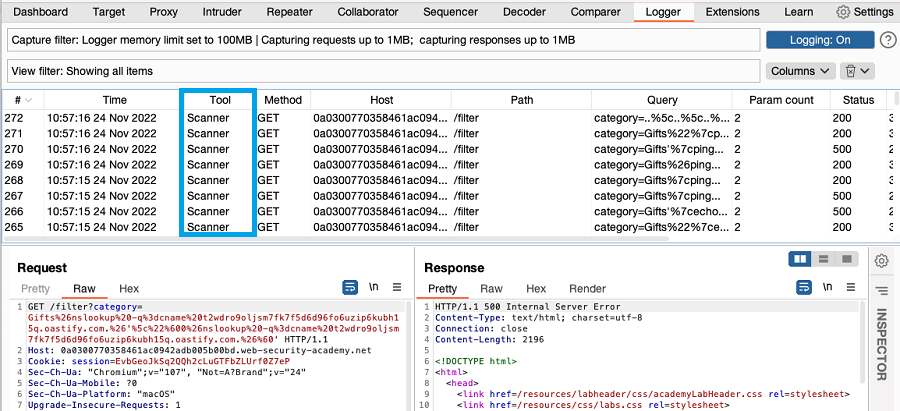
Step 4: Examine the requests made by Burp Scanner
Examine the Tool column to identify the requests that Burp Scanner makes as it performs the audit. Select a request to see it displayed in the message editor.
Note
Burp Scanner requests are not shown in the HTTP history, as they are not trafficked through a proxied browser. Only the Logger tab shows the requests that Burp Scanner makes as it performs the audit.
Step 5: Filter the log
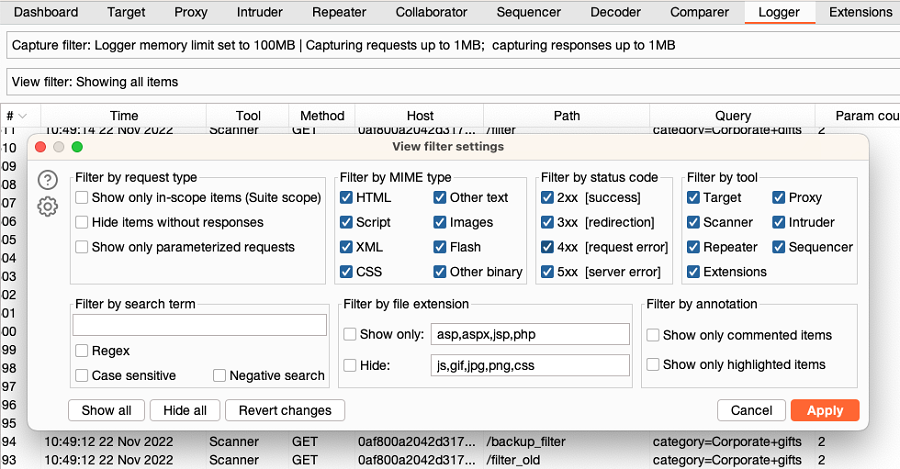
To filter which requests are shown, click the View filter bar. For more information, see Configuring the Burp Logger view filter.
Note
You can also control which requests are logged in the first place. To do this, click the Capture filter bar. These settings also control how much memory the log is allowed to use, and the maximum size of requests and responses are stored. For more information, see Configuring the Burp Logger capture filter.
Step 6: Disable and clear the Logger history
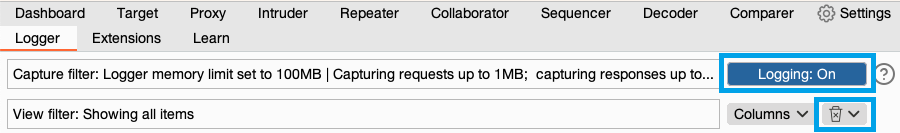
To disable the logging for all items, click the Logging: On/Off button.
To clear the log entirely, click on the trash icon at the top right of the screen. Once cleared, the log cannot be retrieved.
Learn more about Logger
This tutorial showed you how to use Burp Logger to study requests sent by Burp Suite.
Related pages
- You can also view the scan results in a task-specific Logger tab. For more information, see Task Logger.
- For a tutorial on how to use Logger with a Burp extension, see Viewing requests sent by Burp extensions using Logger.